

Chi-Square Test Calculator – Test of Independence for Contingency Tables in 2 Easy Steps
🔥 Chi-Square Test of Independence
Enter your observed frequencies below to calculate the Chi-Square statistic, Degrees of Freedom, and statistical significance.
Use this free chi-square test calculator to check whether two categorical variables are related, straight from a table of observed counts.
Quick answer
The chi-square test of independence compares observed counts with the counts you would expect if the two variables were unrelated. Expected = (row total × column total) / grand total and χ² = Σ (O − E)² / E, with df = (rows − 1)(columns − 1). Example: a 2 × 2 table of 30, 20 / 15, 35 gives χ² = 9.09 with df = 1. That is above the 0.05 critical value of 3.84, so the relationship is significant (p ≈ 0.003).
Table of Contents
Chi-square is the standard test for counts in categories: does product preference depend on age group, is pass rate linked to teaching method, do click-through rates differ by ad version? Any time your data are frequencies in a table, this is the test to reach for.
Calculating expected counts and summing (O − E)² / E for every cell is tedious. Our chi-square test calculator builds the grid for any number of rows and columns and returns the statistic, degrees of freedom and a clear significance verdict.
Chi-Square Test Formula
Eᵢⱼ = (row i total × column j total) / grand total
χ²  = Σ (Oᵢⱼ − Eᵢⱼ)² / Eᵢⱼ
df  = (rows − 1) × (columns − 1)
O is the observed count and E the expected count for each cell. The bigger the gap between observed and expected counts, the larger χ² becomes and the stronger the evidence that the variables are related.
Worked Example: 2 × 2 Table
100 customers were asked whether they prefer Plan A or Plan B, split by new and returning customers.
| Plan A | Plan B | Total | |
|---|---|---|---|
| New | 30 | 20 | 50 |
| Returning | 15 | 35 | 50 |
| Total | 45 | 55 | 100 |
- Expected counts: New/Plan A = 50 × 45 / 100 = 22.5, New/Plan B = 27.5, Returning/Plan A = 22.5, Returning/Plan B = 27.5.
- χ² = (30 − 22.5)²/22.5 + (20 − 27.5)²/27.5 + (15 − 22.5)²/22.5 + (35 − 27.5)²/27.5 = 9.09.
- df = (2 − 1)(2 − 1) = 1. The critical value at α = 0.05 is 3.84.
- Because 9.09 > 3.84, plan choice is significantly related to customer type (p ≈ 0.003).
Worked Example: 2 × 3 Table
Observed counts of 20, 30, 50 in the first row and 30, 25, 15 in the second give χ² = 16.52 with df = 2. The 0.05 critical value for df = 2 is 5.99, so the result is significant (p ≈ 0.0003).
How to Use the Chi-Square Test Calculator
Step 1: Set Up the Table and Enter Observed Counts
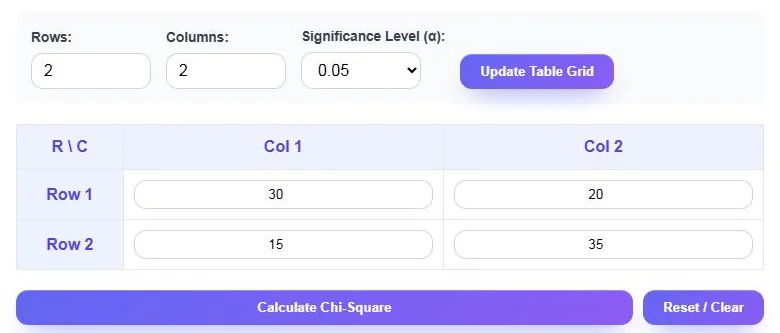
Enter the number of Rows and Columns, choose the Significance Level (α) of 0.01, 0.05 or 0.10, and click Update Table Grid. Type the observed count for each cell, then click Calculate Chi-Square.
Step 2: Read χ², Degrees of Freedom and Significance
The Statistical Results panel shows the chi-square statistic, the degrees of freedom, whether p is below or above your α, and a label saying whether there is a significant relationship. Use Copy Results, Download CSV or Share Tool.

Critical Values of Chi-Square
| df | α = 0.10 | α = 0.05 | α = 0.01 |
|---|---|---|---|
| 1 | 2.706 | 3.841 | 6.635 |
| 2 | 4.605 | 5.991 | 9.210 |
| 3 | 6.251 | 7.815 | 11.345 |
| 4 | 7.779 | 9.488 | 13.277 |
| 6 | 10.645 | 12.592 | 16.812 |
If your χ² is larger than the value for your df and α, the result is significant.
Assumptions and Conditions
- Counts, not percentages: enter raw frequencies. Percentages or means give wrong results.
- Independent observations: each person or item is counted in one cell only.
- Expected counts: every expected count should be at least 1, and at least 80% should be 5 or more. For small 2 × 2 tables, use Fisher’s exact test instead.
- No continuity correction: the calculator reports the standard Pearson χ². Some textbooks apply Yates’ correction for 2 × 2 tables, which gives a slightly smaller value (7.92 for the example above).
How to Report a Chi-Square Result
Write the statistic with its degrees of freedom, sample size and p-value, for example: “A chi-square test of independence showed a significant relationship between customer type and plan choice, χ²(1, N = 100) = 9.09, p < .05.”
Common Mistakes
- Entering percentages instead of counts.
- Counting the same person in more than one cell.
- Using chi-square with many expected counts below 5.
- Concluding cause and effect from a significant association.
Frequently Asked Questions
What does a chi-square test calculator do?
It takes a table of observed counts, works out the expected counts and returns the chi-square statistic, degrees of freedom and whether the two variables are significantly related.
How do you calculate degrees of freedom for chi-square?
Multiply (number of rows − 1) by (number of columns − 1). A 3 × 4 table has 2 × 3 = 6 degrees of freedom.
What is a significant chi-square value?
It depends on the degrees of freedom. For df = 1 at α = 0.05, any χ² above 3.841 is significant.
Can I use percentages in a chi-square test?
No. Always enter raw counts. Percentages change the sample size and give wrong results.
Does the calculator use Yates’ correction?
No. It reports the standard Pearson chi-square without continuity correction.
Is this chi-square calculator free?
Yes. It is free, runs in your browser and needs no sign-up.