

Pearson Correlation Calculator – Find r and r² in 2 Easy Steps
Pearson Correlation Coefficient (r)
Enter your data sets below to find the statistical relationship between two variables.
Variable X (Independent)
Enter values separated by commas or new lines.
Variable Y (Dependent)
Must have the exact same number of values as X.
Use this free Pearson correlation calculator to measure the strength and direction of the straight-line relationship between two variables.
Quick answer
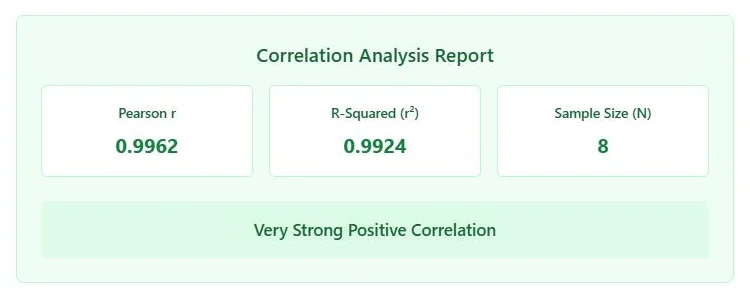
The Pearson correlation coefficient r measures how closely paired data follow a straight line, from −1 (perfect negative) through 0 (no linear link) to +1 (perfect positive). The formula is r = Σ(x − x̄)(y − ȳ) / √[Σ(x − x̄)² · Σ(y − ȳ)²]. Example: hours studied 1 to 8 against scores 52, 55, 61, 64, 70, 72, 79, 83 give r = 0.9962 and r² = 0.9924, a very strong positive correlation.
Table of Contents
Pearson’s r is the most widely used correlation statistic. Researchers, students and analysts use it to check whether advertising spend tracks sales, whether study time tracks grades, or whether two sensors agree.
Working it out by hand means finding means, deviations, products and square roots for every pair. Our Pearson correlation calculator does it instantly and adds r² and a plain-English label so the result is easy to report.
Pearson Correlation Formula
r = Σ(xᵢ − x̄)(yᵢ − ȳ) / √[ Σ(xᵢ − x̄)² × Σ(yᵢ − ȳ)² ]

x̄, ȳ = means of X and Y
r²    = share of variation in Y explained by a straight line on X
The numerator measures how X and Y vary together (covariance). The denominator scales it by the spread of each variable, so r always falls between −1 and +1 and does not depend on units.
Worked Examples
Example 1: study hours and exam scores
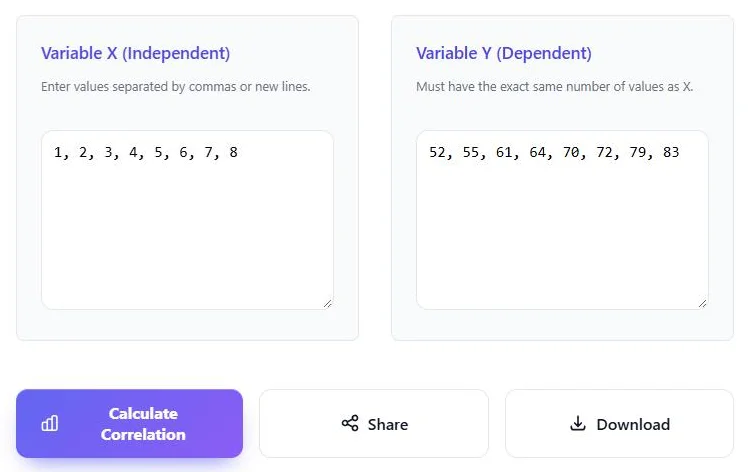
X = 1, 2, 3, 4, 5, 6, 7, 8 hours and Y = 52, 55, 61, 64, 70, 72, 79, 83 marks. The calculator gives r = 0.9962 and r² = 0.9924, so about 99% of the variation in scores lines up with study time in this sample.
Example 2: price and units sold
Prices of 10, 20, 30, 40 and 50 with sales of 90, 75, 70, 55 and 40 units give r = −0.9897. The negative sign shows that higher prices go with fewer sales.
Example 3: a weak relationship
Heights 60, 62, 65, 68, 70, 72 and test scores 55, 70, 58, 72, 60, 66 give r = 0.3029, a weak positive relationship that could easily be chance with only six pairs.
How to Use the Pearson Correlation Calculator
Step 1: Enter the X and Y Data
Paste the first variable into Variable X (Independent) and the second into Variable Y (Dependent), separated by commas or new lines. Each X value must line up with its Y value, and both lists must be the same length. Click Calculate Correlation.
Step 2: Read r, r² and the Strength Label
The Correlation Analysis Report shows Pearson r, R-squared (r²), the sample size N and a label such as “Very Strong Positive Correlation”. Use Share or Download to keep the result.
How to Interpret Pearson r
| |r| | Common interpretation |
|---|---|
| 0.00 – 0.19 | Very weak or none |
| 0.20 – 0.39 | Weak |
| 0.40 – 0.59 | Moderate |
| 0.60 – 0.79 | Strong |
| 0.80 – 1.00 | Very strong |
These bands are a widely used rule of thumb. What counts as strong depends on the field: r = 0.3 can matter in social science, while lab measurements often need r above 0.95.
Assumptions to Check
- Linear pattern: plot the data first. A curved pattern can give a low r even when the variables are clearly related.
- Numeric data: both variables should be measured on an interval or ratio scale.
- No extreme outliers: one unusual point can raise or lower r a lot.
- Paired observations: each X must belong to the same case as its Y.
If your data are ranks, are skewed, or have outliers, use Spearman’s rank correlation instead.
Correlation Is Not Causation
A strong r tells you two variables move together, not that one causes the other. Ice cream sales and sunburn cases are strongly correlated because both rise in hot weather. Use experiments or regression with control variables to study cause and effect.
Common Mistakes
- Entering X and Y in different orders so pairs no longer match.
- Treating r² as a percentage of cases rather than of variation.
- Calling a correlation significant without a significance test or enough data.
- Using r for a clearly curved relationship.
Frequently Asked Questions
What does a Pearson correlation calculator do?
It calculates the Pearson correlation coefficient r for two lists of paired numbers, showing how strongly they follow a straight-line relationship.
What is a good Pearson correlation value?
Values above 0.7 or below −0.7 are usually called strong. Whether that is good depends on your field and purpose.
What is the difference between r and r²?
r shows strength and direction from −1 to +1. r² is always positive and shows the share of variation in Y explained by a linear relationship with X.
Can Pearson r be greater than 1?
No. r is always between −1 and +1. A value outside that range means a calculation error.
When should I use Spearman instead of Pearson?
Use Spearman for ranked or ordinal data, skewed data, data with outliers, or relationships that are consistent in direction but not straight.
Is this Pearson correlation calculator free?
Yes. It is free, runs in your browser and needs no sign-up.