

Normal Distribution Calculator – Area Under the Curve and Z-Scores in 2 Easy Steps
Normal Distribution Calculator
Calculate probabilities, p-values, and area under the normal curve.
Distribution Parameters
Probability Type
Use this free normal distribution calculator to find the area under the bell curve below, above, between or outside any values.
Quick answer
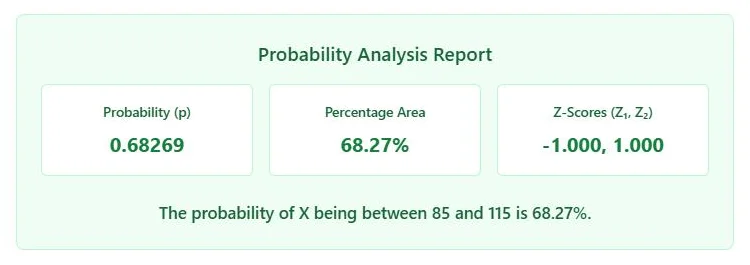
For a normal distribution with mean μ and standard deviation σ, convert X to a z-score with z = (X − μ) / σ and read the area under the standard normal curve. Example: with μ = 100 and σ = 15, P(X < 130) = 0.97725 (z = 2), and P(85 < X < 115) = 0.68269 (z = −1 to 1). The calculator returns the probability, the percentage area and the z-scores in one click.
Table of Contents
The normal distribution, or bell curve, describes test scores, heights, measurement errors, manufacturing tolerances and many other real-world values. Questions such as “what share of students score above 85?” or “how many parts fall within tolerance?” are all normal probability questions.
Looking these up in a z-table is slow and limited to two decimal places. Our normal distribution calculator works out the exact area from the mean, standard deviation and the value or range you choose.
Normal Distribution Formulas
Every normal probability is found by standardising the value and taking the area under the standard normal curve (mean 0, standard deviation 1):
z = (X − μ) / σ
P(X < x)       = Φ(z)
P(X > x)       = 1 − Φ(z)
P(x₁ < X < x₂) = Φ(z₂) − Φ(z₁)
Outside         = 1 − [Φ(z₂) − Φ(z₁)]
Φ(z) is the cumulative distribution function of the standard normal curve, the same value a z-table gives.
The 68-95-99.7 Rule
| Range | Z-scores | Area inside | Example (μ = 100, σ = 15) |
|---|---|---|---|
| μ ± 1σ | −1 to 1 | 68.27% | 85 to 115 |
| μ ± 2σ | −2 to 2 | 95.45% | 70 to 130 |
| μ ± 3σ | −3 to 3 | 99.73% | 55 to 145 |
Use the rule for quick estimates and the normal distribution calculator for exact values at any point.
Worked Examples
Example 1: IQ score below 130
IQ scores have μ = 100 and σ = 15. z = (130 − 100) / 15 = 2, so P(X < 130) = 0.97725. About 97.7% of people score below 130.
Example 2: exam score above 85
An exam has μ = 70 and σ = 10. z = 1.5, so P(X > 85) = 0.06681. Roughly 6.7% of students score above 85.
Example 3: heights between 160 and 180 cm
Adult heights in a group have μ = 170 cm and σ = 7 cm. The z-scores are −1.43 and 1.43, so P(160 < X < 180) = 0.84687, or about 85% of the group.
Example 4: outside a tolerance band
With μ = 100 and σ = 15, the share of values outside 70 to 130 is 0.04550, which is the 4.55% that lies beyond two standard deviations.
How to Use the Normal Distribution Calculator
Step 1: Enter the Mean, Standard Deviation and Values
Type the Mean (μ) and Standard Deviation (σ). Choose the Area / Type: Below X, Above X, Between X₁ and X₂, or Outside X₁ and X₂. Enter the value or the two values, then click Calculate Probability.

Step 2: Read the Probability, Percentage and Z-Scores
The Probability Analysis Report shows the probability as a decimal, the same area as a percentage, and the z-score (or both z-scores for a range), followed by a one-line summary. Use Share or Download to keep the result.
Choosing Below, Above, Between or Outside
| Question wording | Area / Type |
|---|---|
| less than, below, at most, under | Below X |
| more than, above, at least, over | Above X |
| between, within, from … to | Between X₁ and X₂ |
| outside, beyond, more extreme than | Outside X₁ and X₂ |
For a continuous distribution, P(X < x) and P(X ≤ x) are the same, so “less than” and “at most” give the same answer.
Using the Calculator for P-Values
For a z-test, set the mean to 0 and the standard deviation to 1, then enter your test statistic. Use Above X for a right-tailed p-value, Below X for a left-tailed one, and Outside with −|z| and |z| for a two-tailed p-value. For example, z = 1.96 two-tailed gives about 0.05.
Common Mistakes
- Entering the variance instead of the standard deviation. If you have σ², take the square root first.
- Using the normal curve for small or very skewed samples where the data are not bell-shaped.
- Putting X₁ larger than X₂ in a between question.
- Forgetting the continuity correction (±0.5) when using the normal curve to approximate a binomial count.
Frequently Asked Questions
What does a normal distribution calculator do?
It finds the probability that a normally distributed value falls below, above, between or outside given values, using the mean and standard deviation.
How do you calculate normal distribution probability?
Convert X to a z-score with z = (X − μ) / σ, then find the area under the standard normal curve to the left or right of z.
What percentage is within one standard deviation?
About 68.27% of values lie within one standard deviation of the mean.
Can I use it as a z-table?
Yes. Set the mean to 0 and the standard deviation to 1, then enter a z value and choose Below X to get Φ(z).
Can the standard deviation be zero?
No. The standard deviation must be greater than zero. A value of 0 or a negative number does not define a normal curve.
Is this normal distribution calculator free?
Yes. It is free, runs in your browser and needs no sign-up.