

T-Test Solver – Independent Two-Sample T-Test Calculator in 2 Easy Steps
T-Test Solver (Independent Two-Sample)
Calculate statistical significance between two groups using Student's t-distribution.
Group 1
Group 2
Use this free t-test solver to check whether the difference between two group means is statistically significant, using only summary statistics.
Quick answer
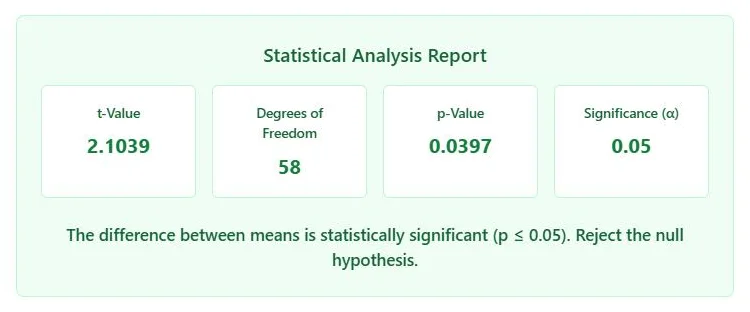
An independent two-sample t-test compares two group means. With pooled variance, t = (M₁ − M₂) / √(s²ₚ(1/n₁ + 1/n₂)) and df = n₁ + n₂ − 2. Example: Group 1 has mean 78, SD 10, n 30 and Group 2 has mean 72, SD 12, n 30. The solver gives t = 2.1039, df = 58 and a two-tailed p = 0.0397, which is below 0.05, so the difference is statistically significant.
Table of Contents
T-tests answer everyday research questions: did the new teaching method raise scores, does version B of a page keep visitors longer, is one machine faster than another? When you only have each group’s mean, standard deviation and size, you can still run the test.
This t-test solver works directly from those summary numbers. It returns the t statistic, degrees of freedom and an exact p-value from the Student t-distribution, then tells you in plain words whether to reject the null hypothesis.
T-Test Formulas
Pooled variance: s²ₚ = [(n₁ − 1)s₁² + (n₂ − 1)s₂²] / (n₁ + n₂ − 2)
Standard error:  SE  = √(s²ₚ × (1/n₁ + 1/n₂))
T statistic:     t   = (M₁ − M₂) / SE
Degrees of freedom: df = n₁ + n₂ − 2
The p-value is the area in the tail (or both tails) of the t-distribution beyond your t-value. The solver reports the one-tailed p-value in the direction of the observed difference, and doubles it for a two-tailed test.
Worked Examples
Example 1: exam scores for two teaching methods
Method A: mean 78, SD 10, n 30. Method B: mean 72, SD 12, n 30. Pooled variance = 122, SE = 2.852, t = 6 / 2.852 = 2.1039 with df = 58. Two-tailed p = 0.0397, below 0.05, so the methods differ significantly. A one-tailed test gives p = 0.0199.
Example 2: a non-significant result
Group 1: mean 5.2, SD 1.1, n 12. Group 2: mean 4.4, SD 1.3, n 12. The solver gives t = 1.6274, df = 22 and a two-tailed p = 0.1179. That is above 0.05, so you fail to reject the null hypothesis; the difference could be due to chance.
How to Use the T-Test Solver
Step 1: Enter Both Groups’ Summary Statistics
For Group 1 and Group 2, enter the Mean, Standard Deviation and Sample Size. Choose a Significance Level (α) of 0.01, 0.05 or 0.10 and pick Two-tailed or One-tailed, then click Calculate T-Test.

Step 2: Read the T-Value, P-Value and Decision
The Statistical Analysis Report shows the t-value, degrees of freedom, p-value and your α, followed by a sentence saying whether the difference is significant and whether to reject the null hypothesis. Use Share or Download to keep the result.
One-Tailed or Two-Tailed?
| Test | Use when | Hypothesis |
|---|---|---|
| Two-tailed | You want to know if the means differ in either direction | H₁: μ₁ ≠ μ₂ |
| One-tailed | You predicted the direction before collecting data | H₁: μ₁ > μ₂ (or <) |
Choose the type before you look at the results. Switching to one-tailed after seeing the data makes results look stronger than they are.
Critical T-Values (Two-Tailed, α = 0.05)
| df | Critical t |
|---|---|
| 10 | 2.228 |
| 20 | 2.086 |
| 22 | 2.074 |
| 30 | 2.042 |
| 58 | 2.002 |
| 120 | 1.980 |
| ∞ | 1.960 |
Assumptions
- Independent groups: different people or items in each group. For before-and-after data on the same subjects, use a paired t-test.
- Roughly normal data: or large enough samples (about 30 per group) for the central limit theorem to help.
- Similar variances: this solver uses the pooled (Student’s) t-test. If one SD is more than about twice the other and group sizes differ a lot, Welch’s t-test is safer.
How to Report a T-Test
Include the means, SDs, t-value, degrees of freedom and p-value, for example: “Scores were higher with Method A (M = 78, SD = 10) than Method B (M = 72, SD = 12), t(58) = 2.10, p = .040.”
Frequently Asked Questions
What does a t-test solver do?
It compares the means of two independent groups and tells you whether the difference is statistically significant, using the t-value, degrees of freedom and p-value.
Can I use summary statistics instead of raw data?
Yes. You only need each group’s mean, standard deviation and sample size.
What does a p-value below 0.05 mean?
It means a difference at least this large would be unlikely if the true means were equal, so the result is called statistically significant at the 5% level.
How are degrees of freedom calculated?
For a pooled two-sample t-test, df = n₁ + n₂ − 2. Two groups of 30 give 58.
Is this a Welch or Student t-test?
It is Student’s t-test with pooled variance, which assumes the two groups have similar variances.
Is the t-test solver free?
Yes. It is free, runs in your browser and needs no sign-up.