

ANOVA Solver – One-Way Analysis of Variance Calculator in 2 Easy Steps
🔥 One-Way ANOVA Solver
Enter your dataset for each group (comma or space separated) to calculate the Sum of Squares, F-Statistic, and P-Value.
Use this free ANOVA solver to test whether the means of three or more groups differ, with a full one-way ANOVA table in one click.
Quick answer
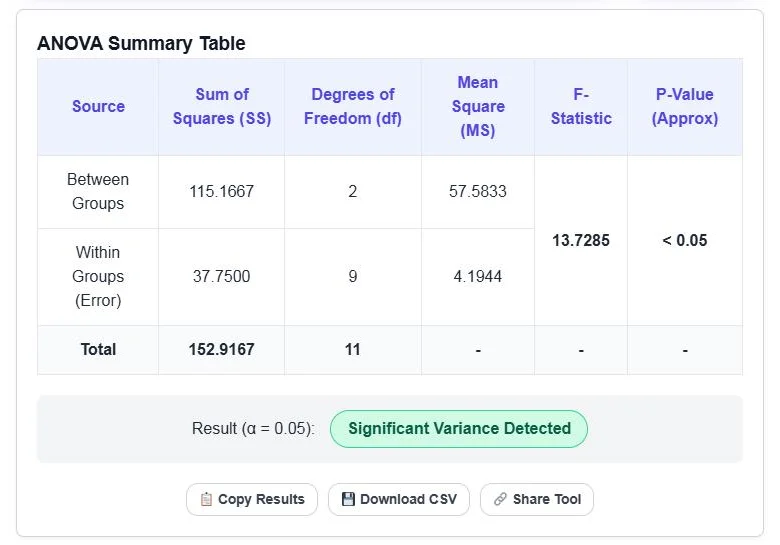
A one-way ANOVA compares group means by splitting total variation into between-groups and within-groups parts. The test statistic is F = MS between / MS within, where MS = SS / df. A large F means the group means differ more than random variation would explain. Example: groups (10, 12, 14, 15), (8, 9, 11, 12) and (15, 17, 18, 20) give SS between = 115.17, SS within = 37.75 and F(2, 9) = 13.73, which is significant at α = 0.05 (p ≈ 0.002).
Table of Contents
ANOVA (analysis of variance) is the standard test when you want to compare the averages of several groups at once, such as three teaching methods, four fertilisers or five ad designs. Running several t-tests instead inflates the chance of a false positive.
Our ANOVA solver takes the raw data for each group, builds the summary table with sums of squares, degrees of freedom, mean squares and F, and tells you whether the result is significant at the 5% level.
One-Way ANOVA Formulas
| Source | SS | df | MS | F |
|---|---|---|---|---|
| Between groups | Σ nⱼ(x̄ⱼ − x̄)² | k − 1 | SSB / (k − 1) | MSB / MSW |
| Within groups | Σ Σ (xᵢⱼ − x̄ⱼ)² | N − k | SSW / (N − k) | |
| Total | Σ Σ (xᵢⱼ − x̄)² | N − 1 |
k is the number of groups, N the total number of values, x̄ⱼ each group mean and x̄ the grand mean. SS total always equals SS between plus SS within.
Worked Example
Three groups of four scores: Group 1 = 10, 12, 14, 15 (mean 12.75), Group 2 = 8, 9, 11, 12 (mean 10.00) and Group 3 = 15, 17, 18, 20 (mean 17.50). The grand mean is 13.42.
- SS between = 4(12.75 − 13.42)² + 4(10 − 13.42)² + 4(17.5 − 13.42)² = 115.17, with df = 2, so MS between = 57.58.
- SS within = 37.75, with df = 9, so MS within = 4.19.
- F = 57.58 / 4.19 = 13.73.
- The critical F(2, 9) at α = 0.05 is about 4.26. Since 13.73 is larger, the group means differ significantly (exact p ≈ 0.0018).
With groups (85, 86, 88, 75, 78, 94), (91, 92, 93, 85, 87, 84) and (79, 78, 88, 94, 92, 85), the solver gives F(2, 15) = 0.81 and p > 0.05, so there is no significant difference.
How to Use the ANOVA Solver
Step 1: Enter the Data for Each Group
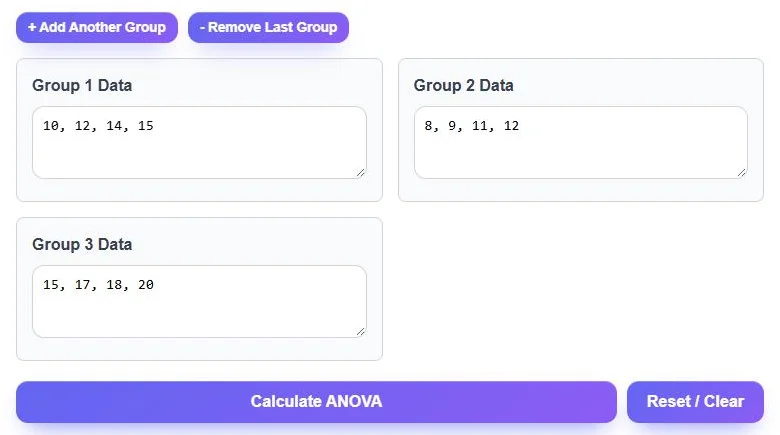
Type or paste the values for each group into Group 1 Data, Group 2 Data and so on, separated by commas or spaces. Use + Add Another Group or - Remove Last Group to match your study, then click Calculate ANOVA.
Step 2: Read the ANOVA Summary Table
The ANOVA Summary Table shows SS, df and MS for between groups, within groups and total, plus the F-statistic and whether p is below or above 0.05. The result badge says whether a significant difference was detected. Use Copy Results, Download CSV or Share Tool.
How to Report ANOVA Results
Report the F value with both degrees of freedom and the p-value, for example: “A one-way ANOVA showed a significant effect of method on score, F(2, 9) = 13.73, p < .05.” Include each group’s mean and standard deviation in a table or the text.
ANOVA Assumptions
- Independence: each value comes from a different subject and groups do not overlap.
- Normality: values in each group are roughly normally distributed. ANOVA is fairly robust with similar group sizes.
- Equal variances: the spread in each group is similar. As a rule of thumb, the largest standard deviation should be less than twice the smallest.
- Numeric outcome: the measured variable is interval or ratio data.
What to Do After a Significant ANOVA
A significant F tells you that at least one group mean is different, not which one. Follow up with a post-hoc test such as Tukey’s HSD or Bonferroni-corrected t-tests to find the specific pairs that differ.
ANOVA vs T-Test
| Situation | Use |
|---|---|
| Compare 2 group means | Independent t-test (or ANOVA, which gives F = t²) |
| Compare 3 or more group means | One-way ANOVA |
| Compare counts in categories | Chi-square test |
| Same subjects measured several times | Repeated-measures ANOVA |
Common Mistakes
- Running many t-tests instead of one ANOVA, which raises the false-positive rate.
- Reading a significant F as proof that every group differs.
- Mixing data from the same subjects across groups.
- Ignoring very unequal variances with very unequal group sizes.
Frequently Asked Questions
What does an ANOVA solver do?
It runs a one-way analysis of variance on your group data and returns the sums of squares, degrees of freedom, mean squares and F-statistic, with a significance decision.
How many groups do I need for ANOVA?
At least two, but ANOVA is mainly used for three or more groups. With two groups it gives the same result as a t-test.
What does the F-statistic mean?
F is the ratio of variation between group means to variation within groups. Values much larger than 1 suggest the means differ.
Why does the solver show p < 0.05 instead of an exact p-value?
The tool reports whether the result is significant at α = 0.05. For an exact p-value, use the F value and both degrees of freedom in an F-distribution table or statistics software.
Can groups have different sizes?
Yes. One-way ANOVA works with unequal group sizes; just enter each group’s values.
Is this ANOVA solver free?
Yes. It is free, runs in your browser and needs no sign-up.