

Binomial Distribution Calculator – Exact and Cumulative Probabilities in 2 Easy Steps
Binomial Distribution Calculator
Calculate cumulative probabilities, expected value, and variance instantly.
Parameters
Use this free binomial distribution calculator to find exact and cumulative probabilities for any number of successes in a fixed number of trials.
Quick answer
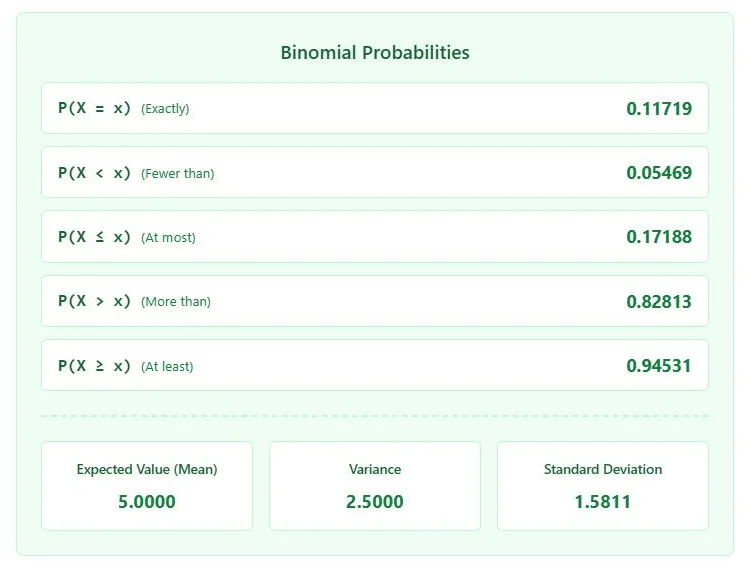
A binomial distribution gives the probability of getting exactly x successes in n independent trials when each trial has the same success probability p. The formula is P(X = x) = C(n, x) · pˣ · (1 − p)ⁿ⁻ˣ. Example: with p = 0.5, n = 10 and x = 3, P(X = 3) = 0.11719, P(X ≤ 3) = 0.17188 and P(X ≥ 3) = 0.94531. The mean is np = 5 and the variance is np(1 − p) = 2.5.
Table of Contents
Binomial probability questions come up everywhere: coin flips, quality checks on a production line, free-throw shooting, survey responses and A/B tests. Doing them by hand means working out combinations and adding many terms for “at most” or “at least” questions, which is slow and easy to get wrong.
Our binomial distribution calculator does all of it at once. Enter the probability of success, the number of trials and the number of successes, and it returns all five probabilities together with the mean, variance and standard deviation.
Binomial Distribution Formula
For a binomial random variable X with n trials and success probability p, the probability of exactly x successes is:
P(X = x) = C(n, x) × p^x × (1 − p)^(n − x)
C(n, x) = n! / (x! × (n − x)!)| Measure | Formula | Meaning |
|---|---|---|
| Mean (expected value) | μ = n × p | Average number of successes |
| Variance | σ² = n × p × (1 − p) | Spread of the number of successes |
| Standard deviation | σ = √(n × p × (1 − p)) | Typical distance from the mean |
| At most x | P(X ≤ x) = Σ P(X = k), k = 0…x | Cumulative probability |
| At least x | P(X ≥ x) = 1 − P(X ≤ x − 1) | Complement of fewer than x |
When Can You Use a Binomial Distribution?
A situation is binomial only when all four conditions are true. If one fails, the binomial distribution calculator will still give a number, but it will not describe your data correctly.
- Fixed number of trials: n is known before you start.
- Two outcomes: each trial is a success or a failure.
- Same probability: p does not change from trial to trial.
- Independent trials: one result does not affect the next.
Worked Examples
Example 1: 10 coin flips, exactly 3 heads
p = 0.5, n = 10, x = 3. C(10, 3) = 120, so P(X = 3) = 120 × 0.5¹⁰ = 0.11719. The chance of at most 3 heads is 0.17188 and at least 3 heads is 0.94531. Mean = 5, variance = 2.5, standard deviation = 1.5811.
Example 2: defective items in a batch
A machine makes 10% defective parts. In a sample of 20 (p = 0.1, n = 20, x = 2), P(X = 2) = 0.28518 and P(X ≤ 2) = 0.67693, so there is about a 32% chance of finding more than 2 defective parts. The expected number is 2.
Example 3: rolling a six
Roll a die 5 times and count sixes (p = 1/6 ≈ 0.16667, n = 5, x = 1). P(X = 1) = 0.40188 and P(X ≥ 1) = 0.59812, so you have roughly a 60% chance of seeing at least one six.
How to Use the Binomial Distribution Calculator
Step 1: Enter p, n and x
Type the Probability of Success (p) as a decimal between 0 and 1, the Number of Trials (n) and the Number of Successes (x) you are interested in. Then click Calculate Probabilities.

Step 2: Read the Probabilities and Summary Values
The results box shows P(X = x) exactly, P(X < x) fewer than, P(X ≤ x) at most, P(X > x) more than and P(X ≥ x) at least, followed by the expected value (mean), variance and standard deviation. Use Share or Download to save the result.
Which Probability Should You Use?
| Question wording | Use | Example (n = 10, p = 0.5, x = 3) |
|---|---|---|
| exactly 3 | P(X = x) | 0.11719 |
| fewer than 3, less than 3 | P(X < x) | 0.05469 |
| at most 3, no more than 3 | P(X ≤ x) | 0.17188 |
| more than 3, over 3 | P(X > x) | 0.82813 |
| at least 3, 3 or more | P(X ≥ x) | 0.94531 |
Binomial vs Normal and Poisson
- Normal approximation: when np and n(1 − p) are both at least 10, the binomial shape is close to a normal curve with mean np and standard deviation √(np(1 − p)). Use a continuity correction of ±0.5.
- Poisson approximation: when n is large and p is small (for example n ≥ 50 and np < 5), a Poisson distribution with λ = np gives a close answer.
- Exact is better: this binomial distribution calculator works out the exact values, so you do not need an approximation for normal-sized problems.
Common Mistakes
- Typing p as a percentage (50) instead of a decimal (0.5).
- Mixing up “fewer than” (P(X < x)) and “at most” (P(X ≤ x)).
- Using the binomial model when trials are not independent, such as drawing cards without replacement from a small deck.
- Choosing x larger than n, which is impossible.
Frequently Asked Questions
What does a binomial distribution calculator do?
It finds the probability of a given number of successes in a fixed number of independent trials, along with cumulative probabilities, the mean, variance and standard deviation.
What is the formula for binomial probability?
P(X = x) = C(n, x) × p^x × (1 − p)^(n − x), where C(n, x) is the number of combinations of n items taken x at a time.
How do I calculate “at least” probability?
Use P(X ≥ x). It equals 1 minus the probability of fewer than x successes. The calculator shows it directly.
What is the mean of a binomial distribution?
The mean is n × p. For 10 trials with p = 0.5 the expected number of successes is 5.
Can p be greater than 1?
No. p is a probability, so it must be between 0 and 1. Enter 0.25 for 25%.
Is this binomial calculator free?
Yes. It is free, runs in your browser and needs no sign-up.