

Spearman's Rank Correlation Calculator – Find Rho (rs) in 2 Easy Steps
Spearman's Rank Correlation (rs)
Calculate the non-parametric statistical dependence between the rankings of two variables.
Variable X (Data or Ranks)
Enter values separated by commas or new lines.
Variable Y (Data or Ranks)
Must have the exact same number of values as X.
Use this free Spearman's rank correlation calculator to measure how strongly two variables move together in rank order.
Quick answer
Spearman's rank correlation (ρ or rs) ranks each variable and measures how well the ranks agree, from −1 (perfect opposite order) to +1 (perfect same order). Without ties, rs = 1 − 6Σd² / (n(n² − 1)), where d is the difference between paired ranks. Example: ranks X = 1 to 7 and Y = 2, 1, 4, 3, 7, 5, 6 give Σd² = 10 and rs = 0.8214, a strong positive relationship. With tied values the calculator uses average ranks.
Table of Contents
Spearman's rho is the go-to correlation when your data are ranks, ratings or scores that are not normally distributed, or when the relationship is consistent in direction but not a straight line. It is common in psychology, education, ecology, market research and quality studies.
Ranking the data, handling ties and summing the squared differences by hand takes time. Our Spearman's rank correlation calculator does it from raw values or ranks and explains the result in plain words.
Spearman's Rank Correlation Formula
No ties:   rs = 1 − (6 × Σd²) / (n × (n² − 1))
With ties: rs = Pearson correlation of the rank values

d = rank of X − rank of Y for each pair
n = number of pairs
Tied values get the average of the ranks they would occupy. For example, if two values share 2nd and 3rd place, both get rank 2.5. The short formula is only exact without ties, so the calculator uses the Pearson-on-ranks method, which is correct in both cases.
Worked Examples
Example 1: two judges ranking 7 entries
| Entry | Judge A rank | Judge B rank | d | d² |
|---|---|---|---|---|
| 1 | 1 | 2 | −1 | 1 |
| 2 | 2 | 1 | 1 | 1 |
| 3 | 3 | 4 | −1 | 1 |
| 4 | 4 | 3 | 1 | 1 |
| 5 | 5 | 7 | −2 | 4 |
| 6 | 6 | 5 | 1 | 1 |
| 7 | 7 | 6 | 1 | 1 |
Σd² = 10 and n = 7, so rs = 1 − (6 × 10) / (7 × 48) = 0.8214. The two judges agree strongly.
Example 2: IQ and hours of TV
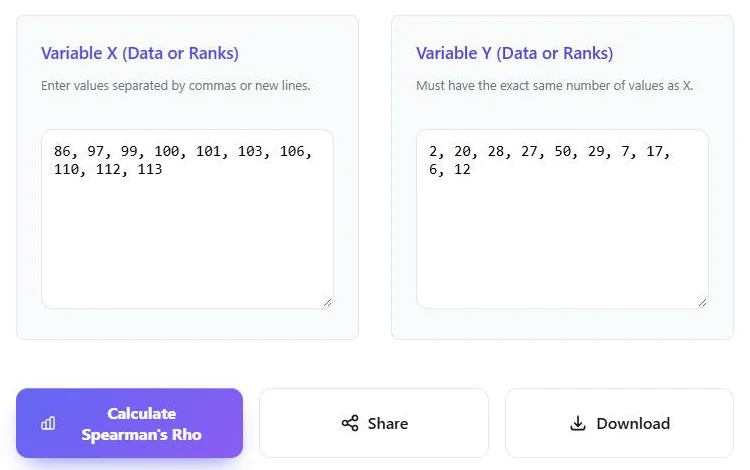
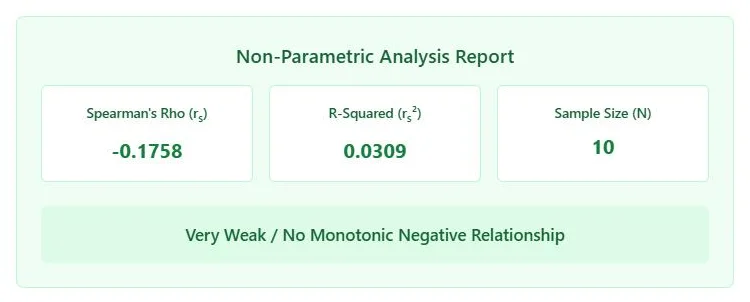
For IQ values 86, 97, 99, 100, 101, 103, 106, 110, 112, 113 and weekly TV hours 2, 20, 28, 27, 50, 29, 7, 17, 6, 12, the calculator returns rs = −0.1758 and rs² = 0.0309, a very weak negative relationship.
Example 3: data with ties
X = 1, 2, 2, 3, 5 and Y = 1, 3, 2, 4, 4 contain ties in both lists. Using average ranks, rs = 0.9474, a very strong positive relationship.
How to Use the Spearman's Rank Correlation Calculator
Step 1: Enter the X and Y Values
Paste the first variable into Variable X (Data or Ranks) and the second into Variable Y (Data or Ranks), separated by commas or new lines. Both lists must have the same number of values, in matching pairs. Click Calculate Spearman's Rho.
Step 2: Read Rho, rs² and the Strength Label
The Non-Parametric Analysis Report shows Spearman's rho (rs), R-squared (rs²), the sample size N and a label describing the strength and direction of the monotonic relationship. Use Share or Download to keep the result.
How to Interpret Spearman's Rho
| |rs| | Common interpretation |
|---|---|
| 0.00 – 0.19 | Very weak or none |
| 0.20 – 0.39 | Weak |
| 0.40 – 0.59 | Moderate |
| 0.60 – 0.79 | Strong |
| 0.80 – 1.00 | Very strong |
A positive sign means higher X ranks go with higher Y ranks; a negative sign means they move in opposite directions. rs² is the share of rank variation the two variables have in common. These bands are a common rule of thumb, and fields such as medicine or psychology may use their own cut-offs.
Spearman vs Pearson Correlation
| Spearman (rs) | Pearson (r) | |
|---|---|---|
| Measures | Monotonic relationship (same order) | Linear relationship (straight line) |
| Data | Ranks, ordinal or any numeric data | Interval or ratio data |
| Outliers | Resistant | Sensitive |
| Normality needed | No | Best with roughly normal data |
If the points rise steadily but curve, Spearman can be close to 1 while Pearson is lower. Run both if you are unsure.
Common Mistakes
- Entering lists of different lengths or in a different pair order.
- Using the short d² formula by hand when there are many ties.
- Reading correlation as cause and effect.
- Trusting a strong rs from very few pairs; with fewer than about 10 pairs, results can change a lot.
Frequently Asked Questions
What does a Spearman's rank correlation calculator do?
It ranks two sets of paired values and calculates Spearman's rho, which shows how strongly and in which direction their rank orders agree.
Can I enter raw data instead of ranks?
Yes. Enter raw values or ranks. The calculator ranks raw data for you, giving tied values their average rank.
What is a good Spearman correlation?
Values above 0.6 or below −0.6 are usually called strong, and above 0.8 or below −0.8 very strong, but the right threshold depends on your field.
How are ties handled?
Tied values receive the average of the ranks they span, and rho is calculated as the Pearson correlation of the ranks, which is exact with ties.
What does a negative rho mean?
A negative rho means that as one variable ranks higher, the other tends to rank lower.
Is this Spearman calculator free?
Yes. It is free, runs in your browser and needs no sign-up.