

Line Graph Maker Online – Enter Data, Pick a Colour, Download PNG
Line Graph Maker
Plot trends and visualize growth instantly. Add your data points, select a primary theme color, and download your graph as a high-resolution image.
Data Points (X/Y)

Quick answer
To use this line graph maker online, type an X-axis label and a Y value for each point, press Add Data Point for more, and pick a line colour. The tool joins the points in order, scales the Y-axis automatically, prints each value above its point and shades the area under the line. Add a title, then press Download Chart to save an 800×500 PNG with a white background. It is free and runs in your browser.
A line graph is the clearest way to show how a number changes over time: website visitors by month, sales by quarter, weight by week or temperature by hour. Rises, dips and steady growth are easy to read at a glance, which is hard to do from a column of numbers.
This free line graph maker online is made for quick trend charts you need in a report, a class project, a slide or a social post. There is no spreadsheet to set up and no sign-up. Enter your points and the scale, grid lines and labels are drawn for you.
Line Graph Maker Online Features
| Feature | How it works |
|---|---|
| Automatic Y-axis | The highest value plus about 15% headroom, rounded up to a clean number |
| Grid lines | Five evenly spaced steps from zero to the top of the scale |
| Short number format | Axis labels shorten large numbers, such as 1.5k or 2M |
| Even X-axis spacing | Points are spread evenly from left to right in the order you enter them |
| Value labels | Each point shows its exact value just above it |
| Shaded area | A soft gradient fill in your line colour sits under the line |
| Line colour | One theme colour for the line, points and fill |
| Download | PNG, 800×500 pixels, white background, named after your title |
How to Use the Line Graph Maker Online
The line graph maker online opens with six sample points, Jan to Jun, titled Website Traffic Growth. The example below adds July, switches the line to blue and renames the chart.
Step 1: Enter an X label and Y value for each point
Each row under Data Points (X/Y) is one point on the line. Type the X-axis label, such as a month or date, and the Y value. The graph preview updates as you type. Press the red ✕ on a row to remove that point. A line needs at least two points, so the last two rows cannot be deleted.

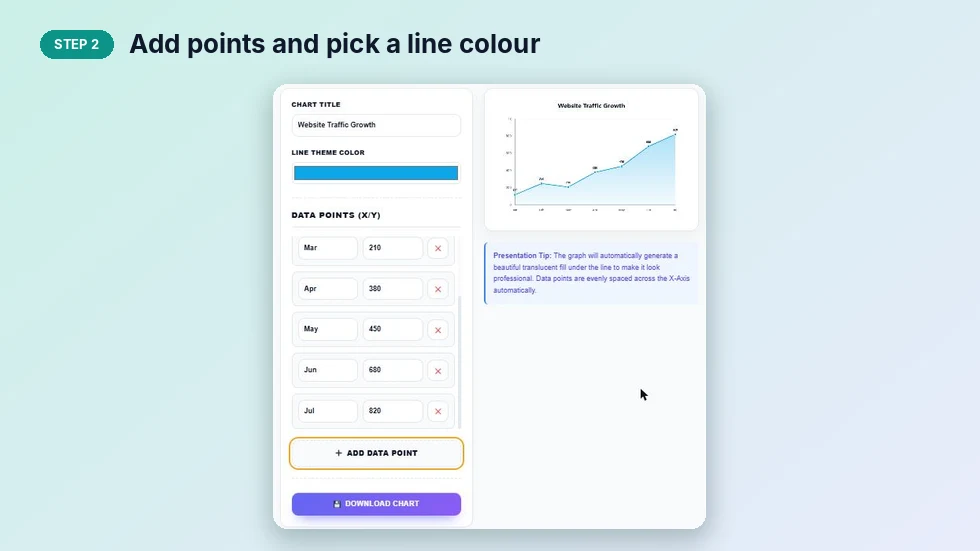
Step 2: Add points and pick a line colour
Press Add Data Point to add a new row at the end, then rename it and enter its value. Click the Line Theme Color bar to choose a colour for the line, points and shaded area. In the example, adding Jul with 820 raised the top of the scale to 1,000 so the whole line still fits.
Step 3: Add a title and download the graph
Type a title in Chart Title and press Download Chart. The PNG includes the title, axis, grid, labels, values and shaded area, so you can place it straight into Word, PowerPoint, Google Slides or a web page.

What You Can Plot with a Line Graph Maker Online
- Website and social growth: monthly visitors, followers or subscribers, so you can show a steady climb or a sudden spike.
- Sales and revenue: weekly, monthly or quarterly totals for a team update or an investor slide.
- School and science projects: temperature readings, plant height or experiment results taken at regular times.
- Personal tracking: savings, weight, running distance or study hours across weeks.
In each case the line graph maker online gives you a clean image in under a minute. If your data has no time order, such as sales by product, a bar chart reads better because there is no trend to follow between the categories.
Line Graph or Another Chart Type?
| Your goal | Best chart |
|---|---|
| Show a trend over time | Line graph |
| Compare separate categories | Bar chart |
| Show how one total splits into parts | Pie chart |
| Spot growth, dips or seasonal patterns | Line graph, with points in time order |
Tips for Clear Graphs with a Line Graph Maker Online
- Enter points in time order. The line joins them exactly as listed.
- Use equal time steps, such as every month, because the X-axis spaces points evenly.
- Keep X labels short. Labels longer than 10 characters are shortened on the graph.
- Put the unit in the title, for example "Monthly Visitors (Thousands)", so readers know what the numbers mean.
- Use zero or positive numbers. The scale always starts at zero.
The line graph maker online does not upload or store anything you type, so download the graph before closing the page. If you want to compare categories instead of a trend, the bar chart maker is a better fit than a line graph.
Frequently Asked Questions
Is this line graph maker online free?
Yes. It is free with no sign-up and no watermark.
How many data points can I add?
As many as you need. You need at least two points to draw a line, and very long lists get crowded labels.
Does the Y-axis scale automatically?
Yes. It uses your highest value plus some headroom and rounds the top to a clean number.
Can I change the line colour?
Yes. Click the Line Theme Color bar to set the colour of the line, points and shaded area.
What size is the downloaded image?
800×500 pixels in PNG format with a white background.
Is my data saved?
No. The graph is drawn in your browser and nothing is stored or uploaded.