

Infographic Maker Online – Build Stats and Timeline Graphics, Download PNG
Infographic Maker
Build beautiful data stories and timelines visually. Add blocks, edit text directly, change theme colors, and download as a high-resolution image.
Theme Colors
Add Blocks

Quick answer
The infographic maker opens with a ready layout. Click any heading, number or paragraph to type your own text, pick accent, background and text colours, and add more Header, Section Title, Number/Stat, Timeline Step or Text Paragraph blocks. Press Download Image to save a high-resolution PNG. It is free, has no watermark and works in your browser.
An infographic packs a message into one tall, easy-to-scan image. A bold title, a few key numbers and a short timeline are often enough to explain a process, share survey results or promote an event on social media. The hard part is usually the design, not the information.
This infographic maker handles the layout for you. Each block has fixed spacing and type sizes, so the result stays tidy no matter how many blocks you add. You focus on the words and colours.
Blocks You Can Add
| Block | What it contains | Use it for |
|---|---|---|
| Header | Large title on an accent background plus a subtitle | The topic of the infographic |
| Section Title | An underlined heading | Splitting the graphic into parts |
| Number/Stat | A big number with a short explanation beside it | Key figures, percentages, totals |
| Timeline Step | A numbered circle, step title and description | Processes, how-to steps, history |
| Text Paragraph | A plain block of text | Context, conclusions, sources, calls to action |
How to Use the Infographic Maker
The starting template has one of each block, with two timeline steps. The example turns it into a short guide called How to Start a Blog.
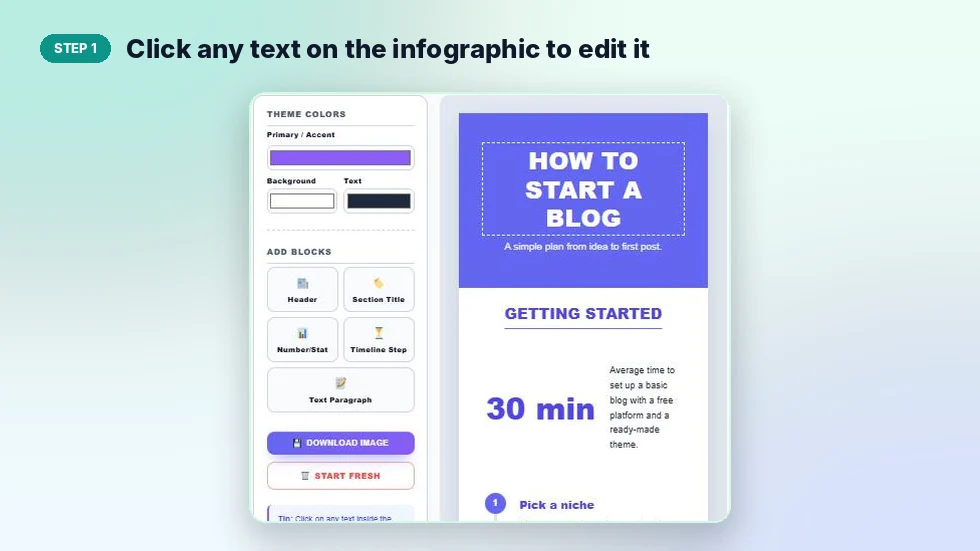
Step 1: Click any text on the infographic to edit it
Every piece of text on the preview is editable. Click the title, a number, a step heading or a paragraph and type over it. Hover a block and press its ✕ to remove it.
Step 2: Set the accent, background and text colours
Under Theme Colors, choose a Primary / Accent colour for the header, numbers, underlines and step circles. Then pick a Background and a Text colour. In the example the accent changed from purple to teal and the whole graphic updated at once.

Step 3: Add blocks, then download the image
Click a button under Add Blocks to place a new block at the bottom of the infographic, then edit its text. When you are happy, press Download Image. The tool hides the editing buttons and saves a PNG at double resolution, named VectraTools-Infographic with a number. Start Fresh empties the canvas after you confirm.

A Simple Structure That Works
- Header: a clear title that promises one thing, such as "5 Steps to a Faster Website".
- One key number: the most surprising or useful figure, with a one-line explanation.
- Three to five timeline steps: short titles and one sentence each.
- A closing paragraph: the takeaway, a website address or where the data came from.
Design Tips
- Pick an accent colour that matches your brand, and keep text dark on a light background for easy reading.
- Keep numbers short, like "30 min" or "75%". Long figures lose their impact.
- Write step titles as actions: "Pick a niche", not "Niche".
- If you share real statistics, name the source in the final paragraph.
- Tall images suit Pinterest and blog posts. For Instagram, keep the graphic short with fewer blocks.
Your work is not saved when you close the page, so download it before leaving. Everything stays in your browser and nothing is uploaded. Need charts instead of text blocks? The pie chart maker and bar chart maker build data visuals you can place alongside an infographic.
Frequently Asked Questions
Is this infographic maker free?
Yes. It is free with no sign-up and no watermark on downloads.
What blocks can I use?
Header, Section Title, Number/Stat, Timeline Step and Text Paragraph. You can add as many as you need.
Can I change the colours?
Yes. Set the accent, background and text colours under Theme Colors and the whole infographic updates.
Can I reorder blocks?
New blocks are added at the bottom. To change the order, delete blocks and add them again in the order you want.
What format is the download?
A high-resolution PNG image, exported at double scale for sharp text.
Is my infographic saved?
No. It stays in your browser only, so download it before closing the page.