

Pivot Point Calculator – Support and Resistance in 3 Easy Steps
Pivot Point Calculator
Use this pivot point calculator to find daily support and resistance zones from previous market data.
Use this free pivot point calculator to turn yesterday’s high, low and close into today’s support and resistance levels. Pick Standard, Fibonacci or Camarilla, enter three prices and the tool lists every level from R3 down to S3 (R4 to S4 for Camarilla).
Quick answer
Standard pivot point P = (High + Low + Close) ÷ 3. Then R1 = 2P − Low, S1 = 2P − High, R2 = P + (High − Low), S2 = P − (High − Low), R3 = High + 2(P − Low) and S3 = Low − 2(High − P). With High 105, Low 95 and Close 102, P = 100.67, R1 = 106.33 and S1 = 96.33.
Table of Contents
Floor traders used pivot points long before charting software. The idea is simple: the previous session’s range and close tell you where buyers and sellers are likely to react today. Price above the pivot is read as a bullish bias, price below it as bearish.
This pivot point calculator works for stocks, forex, crypto, futures and indices. It does the arithmetic so you can mark the levels on your chart before the open.
Pivot Point Formulas
Standard (Floor) Pivots
- P = (H + L + C) ÷ 3
- R1 = 2P − L, S1 = 2P − H
- R2 = P + (H − L), S2 = P − (H − L)
- R3 = H + 2(P − L), S3 = L − 2(H − P)
Fibonacci Pivots
- P = (H + L + C) ÷ 3
- R1 / S1 = P ± 0.382 × (H − L)
- R2 / S2 = P ± 0.618 × (H − L)
- R3 / S3 = P ± 1.000 × (H − L)
Camarilla Pivots
- R1 / S1 = C ± (H − L) × 1.1 ÷ 12
- R2 / S2 = C ± (H − L) × 1.1 ÷ 6
- R3 / S3 = C ± (H − L) × 1.1 ÷ 4
- R4 / S4 = C ± (H − L) × 1.1 ÷ 2
Camarilla levels are built around the close rather than the pivot, so they sit much tighter to the current price.
How to Use the Pivot Point Calculator
Step 1: Enter the Previous High, Low and Close
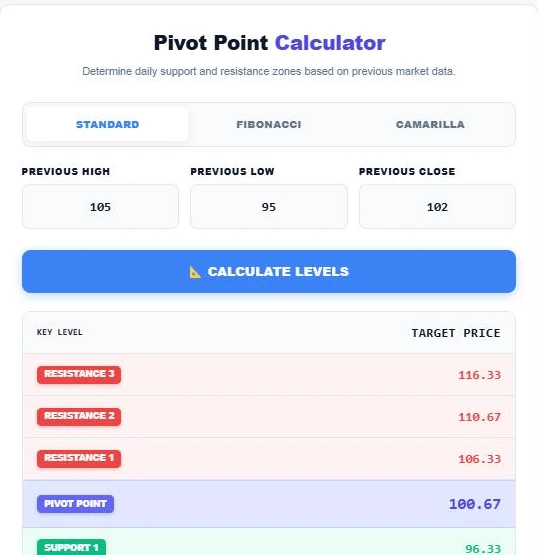
Choose the Standard tab and type the last session’s Previous High, Previous Low and Previous Close. In this example the values are 105, 95 and 102.
Step 2: Read the Standard Levels
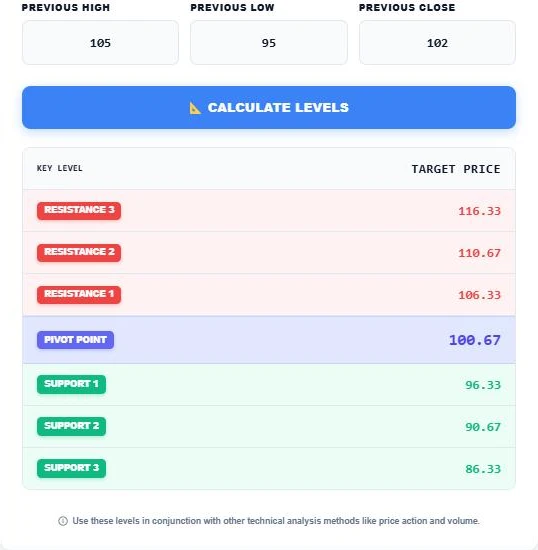
Press Calculate Levels. The table shows the Pivot Point at 100.67, resistance at 106.33, 110.67 and 116.33, and support at 96.33, 90.67 and 86.33. Red rows are resistance, green rows are support.
Step 3: Switch to Fibonacci or Camarilla
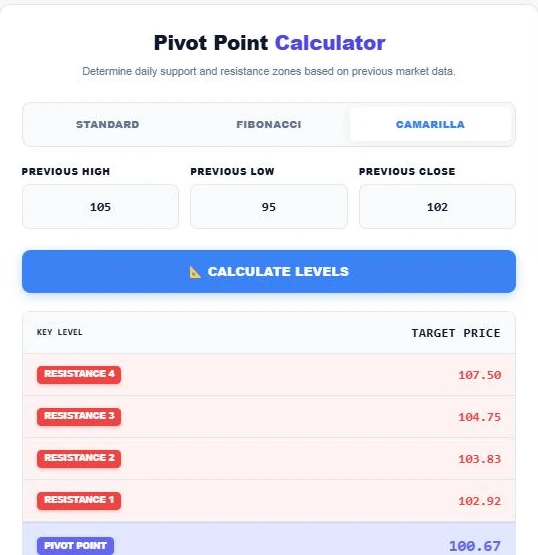
Click Camarilla and calculate again. With the same prices you get R1 102.92, R2 103.83, R3 104.75 and R4 107.50, plus S1 101.08 down to S4 96.50. The Fibonacci tab gives R1 104.49, R2 106.85, R3 110.67 and S1 96.85, S2 94.49, S3 90.67.
Comparing the Three Methods
| Level | Standard | Fibonacci | Camarilla |
|---|---|---|---|
| R3 | 116.33 | 110.67 | 104.75 |
| R2 | 110.67 | 106.85 | 103.83 |
| R1 | 106.33 | 104.49 | 102.92 |
| Pivot | 100.67 | 100.67 | 100.67 |
| S1 | 96.33 | 96.85 | 101.08 |
| S2 | 90.67 | 94.49 | 100.17 |
| S3 | 86.33 | 90.67 | 99.25 |
Results for High 105, Low 95, Close 102. Camarilla also adds R4 107.50 and S4 96.50.
Which Pivot Method Should You Use?
- Standard is the most widely watched, so its levels can attract more orders. A good default for daily charts.
- Fibonacci spaces levels by 38.2%, 61.8% and 100% of the range, which suits traders who already use Fibonacci retracements.
- Camarilla keeps levels close to price. Many intraday traders look for reversals at R3 or S3 and breakouts beyond R4 or S4.
Which Prices to Enter
- For day trading, use the previous day’s high, low and close.
- For swing trading, use the previous week’s values to get weekly pivots.
- For position trading, use the previous month’s values.
- Forex and crypto trade around the clock, so choose one fixed session close (for example 5 pm New York time or 00:00 UTC) and stick with it.
Practical Tips
- Treat each level as a zone, not an exact price.
- Look for confirmation from candlestick patterns, volume or momentum before acting.
- Levels that line up with older support, resistance or round numbers tend to matter more.
- Gaps at the open can push price straight past the first levels.
Pivot points describe where price might react. They do not predict direction, and this page is for education only, not financial advice. Always manage risk with a stop loss and position size you can afford.
Pivot Point Calculator Example for a Stock
Say a stock closed at 248.40 after trading between 244.10 and 251.90. The pivot is (251.90 + 244.10 + 248.40) ÷ 3 = 248.13. R1 = 2 × 248.13 − 244.10 = 252.17 and S1 = 2 × 248.13 − 251.90 = 244.37.
If the stock opens above 248.13, many traders watch R1 near 252 as the first target. A drop below the pivot shifts attention to S1 near 244. Enter your own prices in the pivot point calculator to get all levels at once.
Related trading tools: the Fibonacci Retracement Calculator, the Crypto Position Size Calculator and the Risk to Reward Calculator.
Frequently Asked Questions
How is the pivot point calculated?
Add the previous high, low and close, then divide by 3. For 105, 95 and 102 the pivot is 100.67.
What do R1 and S1 mean?
R1 is the first resistance level above the pivot and S1 is the first support level below it.
Which is better, Standard, Fibonacci or Camarilla pivots?
None is always better. Standard is the most common, Fibonacci suits Fibonacci users and Camarilla suits short intraday trades.
Do pivot points work for crypto and forex?
Yes. Use a fixed daily close time because these markets trade 24 hours.
Can I calculate weekly pivot points?
Yes. Enter the previous week’s high, low and close instead of the daily values.
Is my data stored?
No. The pivot point calculator runs in your browser and nothing is saved.