

Stock Average Down Calculator – New Average Price in 3 Easy Steps
Stock Average Down Calculator
Use this stock average down calculator to find your new average cost per share when buying more at a lower price.
Use this free stock average down calculator to see your new average cost per share after buying more of a stock at a lower price. Enter the shares you own and their average price, then the shares you plan to buy and the new price, and the tool shows your new average, total shares and total money invested.
Quick answer
New average price = (Current shares × Current average + New shares × New price) ÷ (Current shares + New shares). If you own 100 shares at $50 and buy 100 more at $30, your new average is (5,000 + 3,000) ÷ 200 = $40 per share, with $8,000 invested.
Table of Contents
Averaging down means buying more of something you already own after its price has dropped. It lowers your break-even point, so the stock does not need to climb all the way back to your original price for you to make money.
This stock average down calculator shows exactly how far your average moves before you commit more money. It works for shares, ETFs, mutual funds and crypto, including fractional amounts.
Average Down Formula
- Total cost = (Current shares × Current average) + (New shares × New price)
- Total shares = Current shares + New shares
- New average price = Total cost ÷ Total shares
- Gain needed to break even = (New average ÷ Current market price − 1) × 100
How to Use the Stock Average Down Calculator
Step 1: Enter Current Holdings and the New Purchase
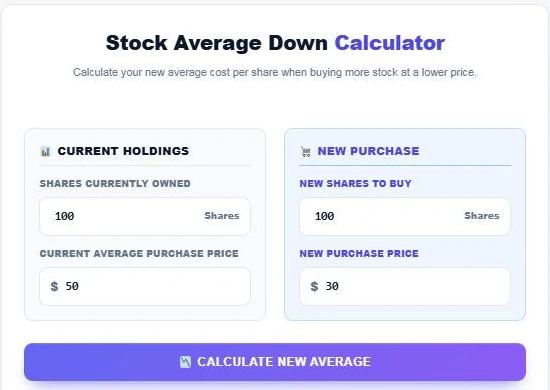
Under Current Holdings, type Shares Currently Owned (100) and your Current Average Purchase Price ($50). Under New Purchase, type New Shares to Buy (100) and the New Purchase Price ($30).
Step 2: Read Your New Average Cost
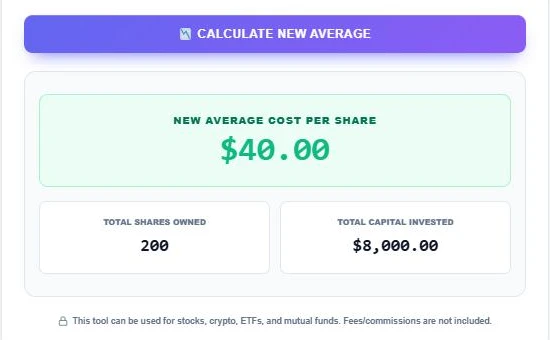
Press Calculate New Average. The new average cost is $40.00 per share. You now own 200 shares with $8,000 invested. The stock only needs to rise from $30 to $40, about 33%, for you to break even, instead of 67% back to $50.
Step 3: Use It for Crypto or Fractional Shares
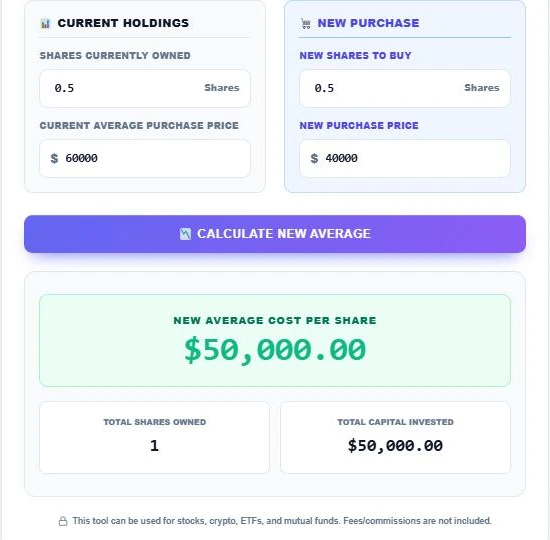
Decimals work too. Holding 0.5 BTC at $60,000 and buying another 0.5 at $40,000 gives a new average of $50,000 on 1 coin, with $50,000 invested.
How Much Should You Buy?
Starting with 100 shares at $50, here is how the size of the second purchase changes your average:
| Buy | At price | New average | Total invested |
|---|---|---|---|
| 50 shares | $40 | $46.67 | $7,000 |
| 100 shares | $40 | $45.00 | $9,000 |
| 200 shares | $40 | $43.33 | $13,000 |
| 100 shares | $30 | $40.00 | $8,000 |
| 300 shares | $30 | $35.00 | $14,000 |
A deeper price drop moves your average more for each dollar spent, but every extra purchase also adds risk if the price keeps falling.
When Averaging Down Makes Sense
- The business or asset is still sound and the drop is due to wider market moves.
- You planned to build the position in stages from the start.
- The extra purchase keeps the position at a size you are comfortable losing.
When to Be Careful
- The price fell because of a real problem, such as falling earnings, heavy debt or fraud.
- You are buying only to “get back to even” rather than because the investment is attractive at today’s price.
- The position would become a large share of your portfolio.
- You would need to borrow or use money meant for other goals.
Average Down vs Average Up
Averaging up means adding to a winning position at a higher price. Your average rises, but you add to something that is working. Enter a higher new price in the calculator to see it: 100 shares at $50 plus 100 at $60 gives a $55 average.
This calculator does not include fees, taxes or currency costs. It is for education only, not financial advice.
Related tools: the PE Ratio Calculator, the Dividend Yield Calculator and the Crypto Position Size Calculator.
Frequently Asked Questions
How do I calculate my average share price after buying more?
Add the cost of all purchases and divide by the total number of shares. 100 at $50 plus 100 at $30 = $8,000 ÷ 200 = $40.
Does averaging down reduce losses?
It lowers your break-even price, but it also increases the amount you have at risk if the price keeps falling.
Can I use this for crypto?
Yes. Enter fractional amounts such as 0.5 coins.
Are fees included?
No. Add fees to your purchase price for a more exact average.
What is averaging up?
Buying more at a higher price than your current average, which raises your average cost.
Is my data stored?
No. The stock average down calculator runs in your browser and nothing is saved.