

PE Ratio Calculator – Price to Earnings (P/E) in 3 Easy Steps
Price-to-Earnings (P/E) Calculator
Use this PE ratio calculator to evaluate a stock's valuation with its P/E ratio and earnings yield.
Use this free PE ratio calculator to find a stock’s price-to-earnings ratio and earnings yield. Enter the share price and earnings per share (EPS), or switch to advanced mode and let the tool work out EPS from net income and shares outstanding.
Quick answer
P/E ratio = Share price ÷ Earnings per share. Earnings yield = EPS ÷ Price × 100, the inverse of P/E. A stock at $150 with EPS of $6 has a P/E of 25 and an earnings yield of 4%. If EPS is negative, the P/E ratio is not meaningful.
Table of Contents
The price-to-earnings ratio tells you how many dollars investors pay for each dollar of a company’s yearly profit. A P/E of 25 means the market values the company at 25 years of current earnings. It is the most quoted valuation number on any stock page.
This PE ratio calculator shows the ratio, the earnings yield and a simple valuation tag, so you can compare stocks quickly and check figures you see quoted elsewhere.
P/E Ratio Formulas
- P/E ratio = Price per share ÷ EPS
- EPS = Net income ÷ Shares outstanding
- Earnings yield = EPS ÷ Price × 100 = 1 ÷ P/E × 100
- Implied price = Target P/E × EPS
How to Use the PE Ratio Calculator
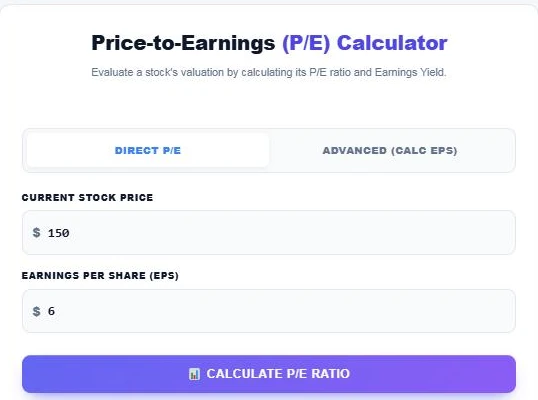
Step 1: Enter the Share Price and EPS
Stay on the Direct P/E tab. Type the Current Stock Price ($150) and the Earnings Per Share ($6). Use trailing twelve-month (TTM) EPS for a trailing P/E, or analyst estimates for a forward P/E.
Step 2: Read the P/E and Earnings Yield
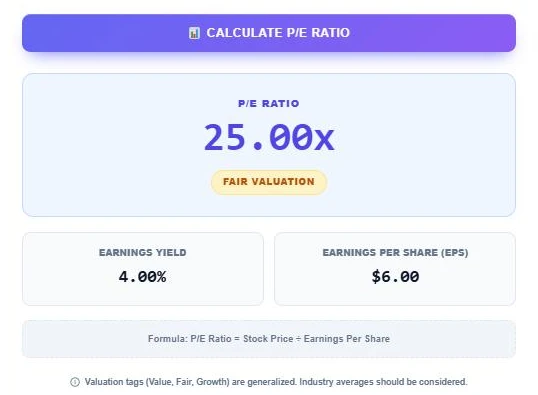
Press Calculate P/E Ratio. The result is a P/E of 25.00x, tagged Fair Valuation, with an earnings yield of 4.00%.
Step 3: Use Advanced Mode to Calculate EPS
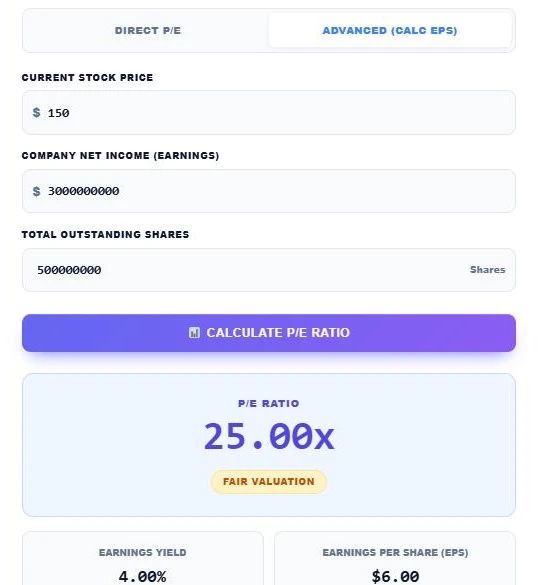
If you only have company totals, open Advanced (Calc EPS). Enter the price ($150), Company Net Income ($3,000,000,000) and Total Outstanding Shares (500,000,000). The tool works out EPS of $6.00 and the same 25x P/E.
How the Valuation Tags Work
| P/E ratio | Tag shown | Earnings yield |
|---|---|---|
| Below 15 | Undervalued / Value Stock | Above 6.7% |
| 15 to 25 | Fair Valuation | 4% to 6.7% |
| Above 25 | Overvalued / Growth Stock | Below 4% |
| Negative EPS | Negative Earnings: P/E Not Meaningful | Negative |
These bands are general rules of thumb. A fast-growing software company can deserve a P/E of 40, while a slow-growing utility at 18 may be expensive. Always compare a stock with its own history and with peers in the same industry.
Trailing vs Forward P/E
- Trailing P/E uses the last 12 months of reported EPS. It is based on real results.
- Forward P/E uses expected EPS for the next 12 months. It reflects growth but depends on estimates.
- A forward P/E well below the trailing P/E means analysts expect earnings to rise.
P/E vs Earnings Yield
Earnings yield flips P/E into a percentage you can compare with bond yields or savings rates. A P/E of 25 equals a 4% earnings yield. A P/E of 10 equals 10%. Many value investors prefer earnings yield because higher is simply better.
Limits of the P/E Ratio
- It is meaningless when earnings are negative or close to zero.
- One-off gains or write-offs can distort EPS for a year.
- It ignores debt; compare EV/EBITDA for companies with heavy borrowing.
- It says nothing about growth; the PEG ratio (P/E ÷ growth rate) helps with that.
This calculator is a learning and screening tool, not financial advice. Do your own research before buying or selling any stock.
PE Ratio Calculator Example: Comparing Two Stocks
Stock A trades at $80 with EPS of $8.50, a P/E of 9.41 and an earnings yield of 10.63%. Stock B trades at $200 with EPS of $4, a P/E of 50 and an earnings yield of 2%.
Stock A looks cheap and Stock B looks expensive, but the right answer depends on growth. If Stock B’s earnings are expected to double in two years, its forward P/E falls to 25. Run both through the PE ratio calculator, then check growth before deciding.
Related tools: the Dividend Yield Calculator, the Stock Average Down Calculator and the Stock Options Profit Calculator.
Frequently Asked Questions
How do you calculate the P/E ratio?
Divide the share price by earnings per share. $150 ÷ $6 = a P/E of 25.
What is a good P/E ratio?
It depends on the industry and growth rate. Many mature companies trade between about 15 and 25.
What does a negative P/E mean?
The company lost money over the period, so the P/E is not meaningful. The calculator shows N/A in that case.
How do I find EPS?
Divide net income by shares outstanding, or use the EPS figure from the company’s earnings report.
What is earnings yield?
EPS divided by price, as a percentage. It is the inverse of the P/E ratio.
Is my data stored?
No. The PE ratio calculator runs in your browser and nothing is saved.