

Fibonacci Retracement Calculator – Levels in 3 Easy Steps
Fibonacci Retracement Levels
Use this Fibonacci retracement calculator to find support, resistance and extension levels for your trades.
Use this free Fibonacci retracement calculator to find the 23.6%, 38.2%, 50%, 61.8% and 78.6% retracement levels of any price swing, plus the 161.8% and 261.8% extension targets. Choose uptrend or downtrend, enter the swing high and swing low, and the levels appear in a table.
Quick answer
In an uptrend, each retracement level = High − (High − Low) × ratio. In a downtrend, level = Low + (High − Low) × ratio. For a move from 100 to 150, the 38.2% level is 130.90, 50% is 125.00 and 61.8% is 119.10. The 161.8% extension target above the high is 180.90.
Table of Contents
After a strong move, prices rarely travel in a straight line. They pull back before the trend continues, and many traders watch the Fibonacci ratios to judge where that pullback might stop. The ratios come from the Fibonacci sequence, where each number is about 61.8% of the next.
This Fibonacci retracement calculator does the maths for stocks, forex, crypto and commodities, so you can mark the levels on your chart in seconds.
Fibonacci Retracement Formulas
Uptrend (price pulled back down)
- Retracement = High − (High − Low) × ratio
- Extension = Low + (High − Low) × ratio, projected above the high
Downtrend (price bounced back up)
- Retracement = Low + (High − Low) × ratio
- Extension = High − (High − Low) × ratio, projected below the low
The standard ratios are 23.6%, 38.2%, 50%, 61.8% and 78.6%. The 50% level is not a true Fibonacci ratio, but traders watch it because a half-way pullback is common.
How to Use the Fibonacci Retracement Calculator
Step 1: Pick the Trend and Enter the Swing
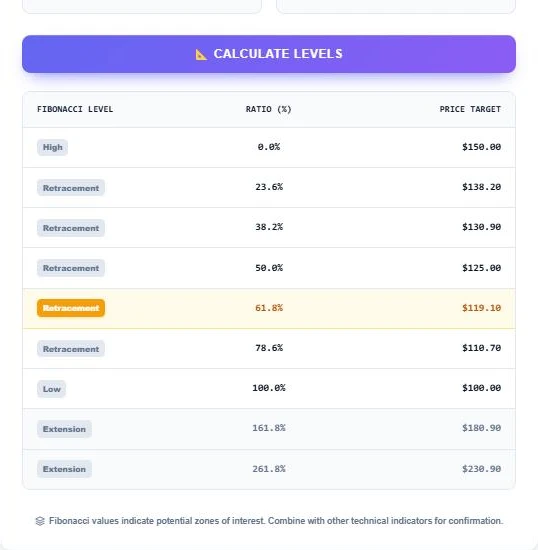
Select Uptrend (Retracing Down) if price rallied and is now pulling back. Enter the Swing High and Swing Low of that rally. In this example the high is 150 and the low is 100.

Step 2: Read the Uptrend Levels
Press Calculate Levels. The table shows 23.6% at 138.20, 38.2% at 130.90, 50% at 125.00, the highlighted 61.8% golden ratio at 119.10 and 78.6% at 110.70. The extension targets above the high are 180.90 (161.8%) and 230.90 (261.8%).
Step 3: Switch to Downtrend
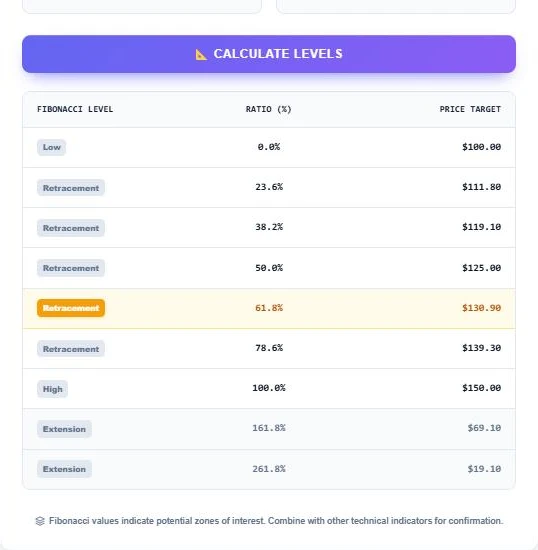
Click Downtrend (Retracing Up) for a fall that is now bouncing. With the same swing, the levels count up from the low: 111.80, 119.10, 125.00, 130.90 and 139.30. Extension targets below the low are 69.10 and 19.10.
Fibonacci Levels at a Glance
| Ratio | Uptrend (100 → 150) | Downtrend (150 → 100) | What traders look for |
|---|---|---|---|
| 23.6% | 138.20 | 111.80 | Shallow pullback in a strong trend |
| 38.2% | 130.90 | 119.10 | Common pullback zone |
| 50% | 125.00 | 125.00 | Half-way point |
| 61.8% | 119.10 | 130.90 | Golden ratio, often the key level |
| 78.6% | 110.70 | 139.30 | Deep pullback, trend may be weakening |
| 161.8% ext. | 180.90 | 69.10 | First profit target |
| 261.8% ext. | 230.90 | 19.10 | Extended target |
How to Pick the Swing High and Low
- Use a clear, completed move. The swing should be obvious on the chart without zooming in.
- For an uptrend, take the lowest low where the rally started and the highest high where it stopped.
- Use wicks or closing prices consistently. Most traders use wicks.
- Higher time frames (daily, weekly) give levels that tend to be respected more than 5-minute swings.
Practical Tips
- Treat each level as a zone, not a single price.
- Look for confluence: a Fibonacci level that lines up with an old support, a moving average or a pivot point is stronger.
- Wait for confirmation, such as a reversal candle or rising volume, before entering.
- A close beyond 78.6% often means the original trend has failed.
Why the 61.8% Level Gets So Much Attention
Divide any Fibonacci number by the next one (34 ÷ 55, 55 ÷ 89) and you get close to 0.618. Divide by the number two places ahead and you get about 0.382. Because so many traders and algorithms watch these ratios, orders tend to cluster near them, which can make them self-fulfilling.
Fibonacci levels show where price might react, not where it will. This page is for education only and is not financial advice. Always size positions and set stops based on the risk you can accept.
Related trading tools: the Pivot Point Calculator, the Crypto Position Size Calculator and the Risk to Reward Calculator.
Frequently Asked Questions
How do you calculate Fibonacci retracement levels?
For an uptrend, subtract (High − Low) × ratio from the high. For 100 to 150, the 61.8% level is 150 − 50 × 0.618 = 119.10.
What are the main Fibonacci retracement ratios?
23.6%, 38.2%, 50%, 61.8% and 78.6%. Extensions are commonly 161.8% and 261.8%.
Which Fibonacci level is most important?
Many traders focus on 61.8%, followed by 38.2% and 50%.
What is the difference between retracement and extension?
A retracement is a pullback inside the original move. An extension projects a target beyond the swing high or low.
Does Fibonacci retracement work for crypto and forex?
Yes. It works on any liquid market, but should be combined with other analysis.
Is my data stored?
No. The Fibonacci retracement calculator runs in your browser and nothing is saved.