

Gantt Chart Maker Online – Simple Project Timelines
Gantt Chart Maker
Plan your project schedule visually. Add tasks, set start and end dates, and update progress to generate a professional timeline.

Quick answer
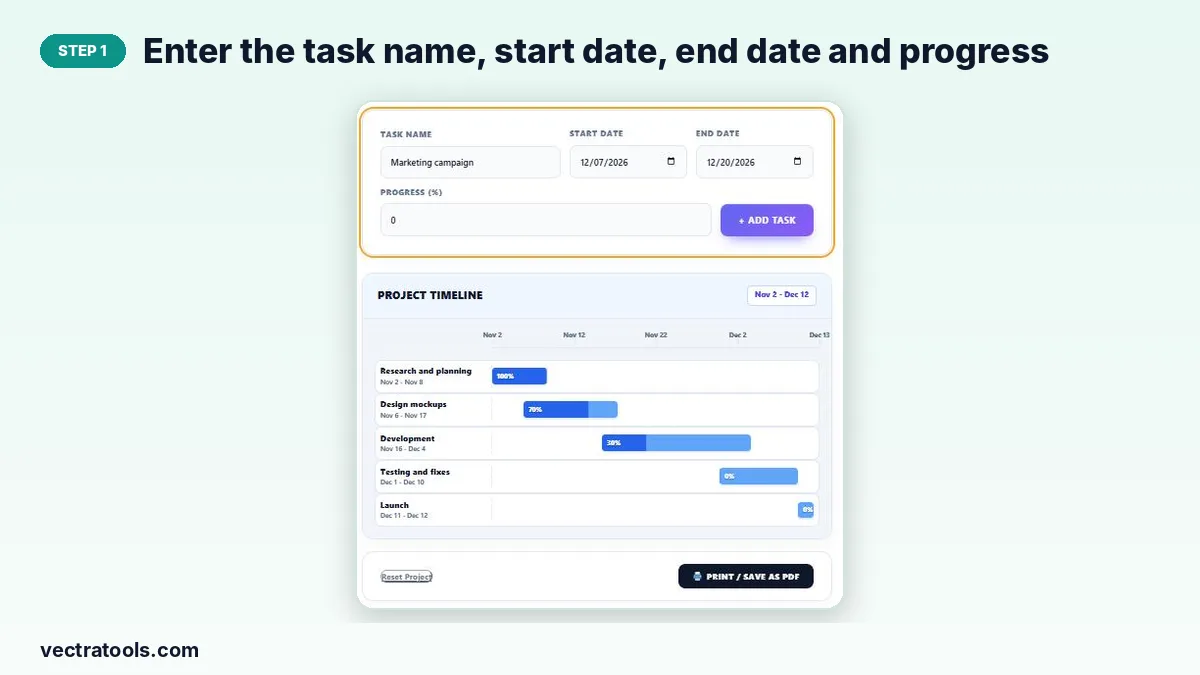
Enter a task name, start date, end date and progress percentage, then press + Add Task. The Gantt chart maker draws each task as a bar on a shared timeline, shading the completed part darker, and shows the overall project date range. Delete tasks with ✕, and press Print / Save as PDF to share the chart.
A Gantt chart shows a project as horizontal bars on a calendar. You can see at a glance when each task starts and ends, which tasks overlap and how far along the work is.
This Gantt chart maker keeps things simple: no accounts, no complex settings. Type in your tasks and the timeline builds itself, scaling automatically to fit the first start date and the last end date.
Example Project Timeline
| Task | Start | End | Progress |
|---|---|---|---|
| Research and planning | 2 Nov | 8 Nov | 100% |
| Design mockups | 6 Nov | 17 Nov | 70% |
| Development | 16 Nov | 4 Dec | 30% |
| Testing and fixes | 1 Dec | 10 Dec | 0% |
| Launch | 11 Dec | 12 Dec | 0% |
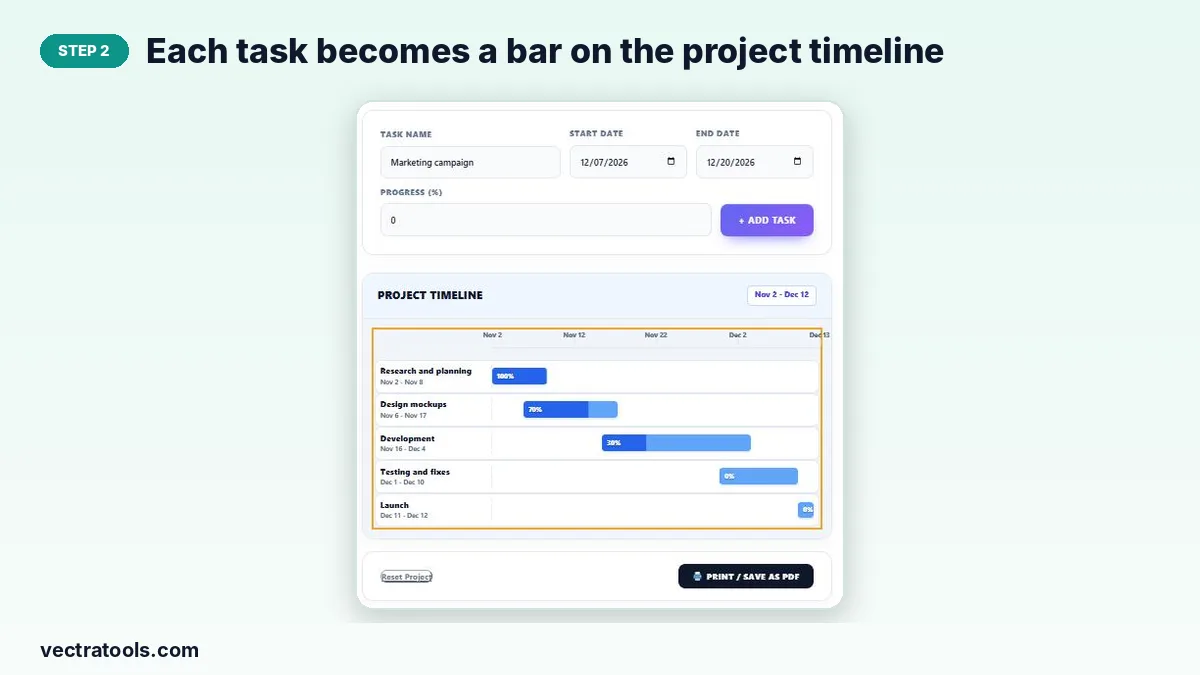
The chart header shows the project span, here 2 Nov to 12 Dec, and overlapping bars make it clear that design and development run in parallel for a few days.
How to Use the Gantt Chart Maker
List your tasks in order before you start. Rough dates are fine; you can delete and re-add a task to change it.
Step 1: Enter the task name, start date, end date and progress
Type the task, pick the start and end dates and enter how much is done as a percentage, then press + Add Task.
Step 2: Each task becomes a bar on the project timeline
The bar’s position and length match the dates, the darker part shows progress, and the axis labels mark dates across the project. Remove a task with ✕.
Step 3: Print or save the chart as PDF
Press Print / Save as PDF to print the timeline or save it for a client or team. Reset Project clears all tasks.

Tips for a Clear Gantt Chart
- Keep task names short so they fit the label column.
- Break long tasks into phases of one to two weeks.
- Update progress weekly so the chart reflects reality.
- Leave a small buffer before deadlines such as a launch date.
Gantt Chart vs Kanban Board
A Gantt chart is best when timing and overlaps matter, such as planning a launch date. A Kanban board is better for day-to-day work where the order changes often. Many teams plan with a Gantt chart and track daily work on a Kanban board.
Why Use an Online Gantt Chart Maker
Full project-management software can take hours to set up for a small project. A Gantt chart maker in the browser gives you a clean timeline in minutes. Use this Gantt chart maker for website launches, events, school projects, content calendars or client proposals that need a simple schedule.
Frequently Asked Questions
Is this Gantt chart maker free?
Yes. It is free with no sign-up.
Is my chart saved?
Yes. Tasks are stored in your browser and reload when you return on the same device.
Can I edit a task?
Delete it with ✕ and add it again with the new dates or progress.
Does it support task dependencies?
No. The chart shows timing and progress; arrange tasks in order to show which follows which.
How do I share the chart?
Press Print / Save as PDF and choose “Save as PDF”, then send the file.
Does it work on phones?
Yes, the timeline scrolls sideways on narrow screens, though a laptop gives the best view.